 Image 1 of 9

 Image 2 of 9

 Image 3 of 9

 Image 4 of 9

 Image 5 of 9

 Image 6 of 9

 Image 7 of 9

 Image 8 of 9

 Image 9 of 9


Planter monitor with mapping
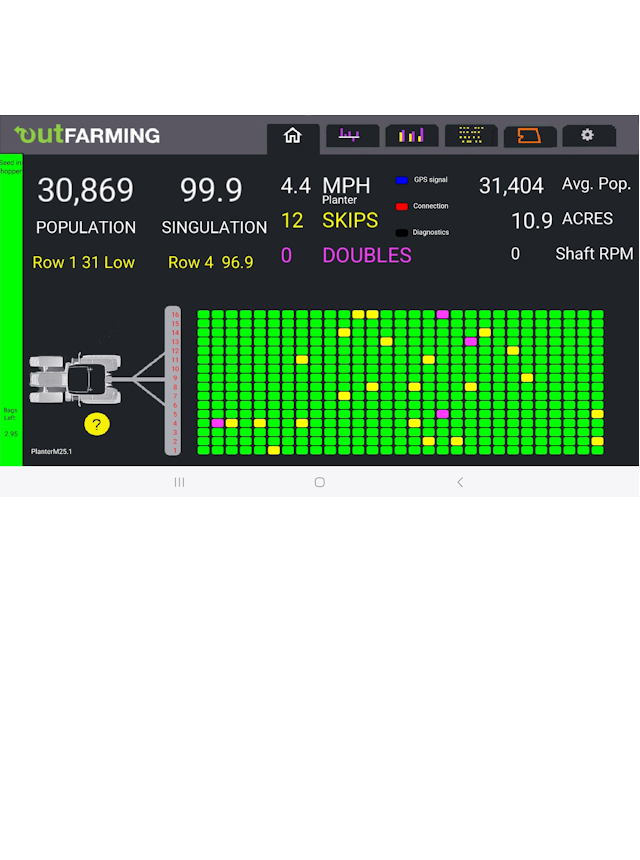
Same basic features as the other monitors but adds mapping capabilities. Easy planter monitor to visually tell you when you have a problem. The main display shows you what’s happened behind your planter for 15 seconds displaying any skips, doubles and an alarm for out-of-seed. There are tabs for a population graph, a skips & doubles graph by row, and an as-planted map. The map captures data every 10 seconds with latitude and longitude. You can walk the field later with the tablet, see where you are at and access the data at that spot: speed, target population, actual population, variety, date, time, singulation. Data can be exported to mapping software. See www.outfarming.com for videos of loading map images and operation. Click here for operating documentation.
If shipping to Canada, add $50 of the “Shipping Cost” item.
If I’m out of stock, contact me to see how soon If I can build one.